Founders raising a new round often open last round's deck, update the numbers and change the date. The slide list survives, and that's fine: problem, solution, market, traction, team and the ask appear at every stage. What should change is the proof on those slides, because each round asks a different question.
This post goes stage by stage, from pre-seed to seed to Series A. It covers what investors are trying to find out, which slides change, how to design the metrics slides that carry a Series A, and what moves to the appendix and the data room. The examples use Northlake Analytics, a fictional company that sells demand-forecasting software to mid-size retailers. For the full slide list and the story that connects it, start with our pitch deck guide.
Why the stage changes the deck
Each round pays for the answer to a different question. Pre-seed money tests whether a team has found a real problem and a credible way to solve it. Seed money tests whether customers want the solution. Series A money goes into scaling something that already works, so investors need to see that it works, and that it keeps working as you add customers.
Your deck's job at each stage is to answer the current question with the best evidence you have. Two things tend to go wrong. Some founders try to answer a later question too early, like a pre-seed deck with a five-year forecast to the dollar. Others keep answering an old one, like a Series A deck that still leans on customer quotes and a waitlist.
You won't find thresholds in this post, such as how much revenue a Series A needs or how big a seed round should be. Those vary by market, investor and year, and a single number would mislead you. What doesn't vary is the kind of evidence each stage calls for.

Pre-seed: the team and the insight
At pre-seed you usually have a team, an insight and a stack of customer conversations. Maybe a prototype. The deck sells two things: that you've spotted something real, and that you're the people to build it.
Put the weight on:
The problem, in customers' words. Say how many potential customers you interviewed and what they told you. Patterns and short quotes from those conversations beat a borrowed industry statistic.
The insight. What you understand that others have missed, in one sentence.
Why now. What has changed that makes this possible, or urgent, today.
Why this team. The experience that makes you credible for this specific problem.
Early signals, labeled honestly. A waitlist, letters of intent or a pilot commitment all help, as long as each is called exactly what it is.
Cut the detailed five-year forecast. At this stage it's a guess, and precise guesses invite questions you can't answer yet. Show what the round buys instead: the next proof point, such as a working product and three paid pilots.
Pre-seed decks often run shorter, around 10–12 slides, because full traction and financials slides would be thin. Don't pad a slide to make the deck look complete. Our guide to how many slides a pitch deck should be covers length by stage and format.
Seed: early proof
At seed, the question becomes: do customers want this? Traction moves to the center of the deck, and the other slides get firmer.
Here's what early proof looks like on the slides, using Northlake Analytics at seed:
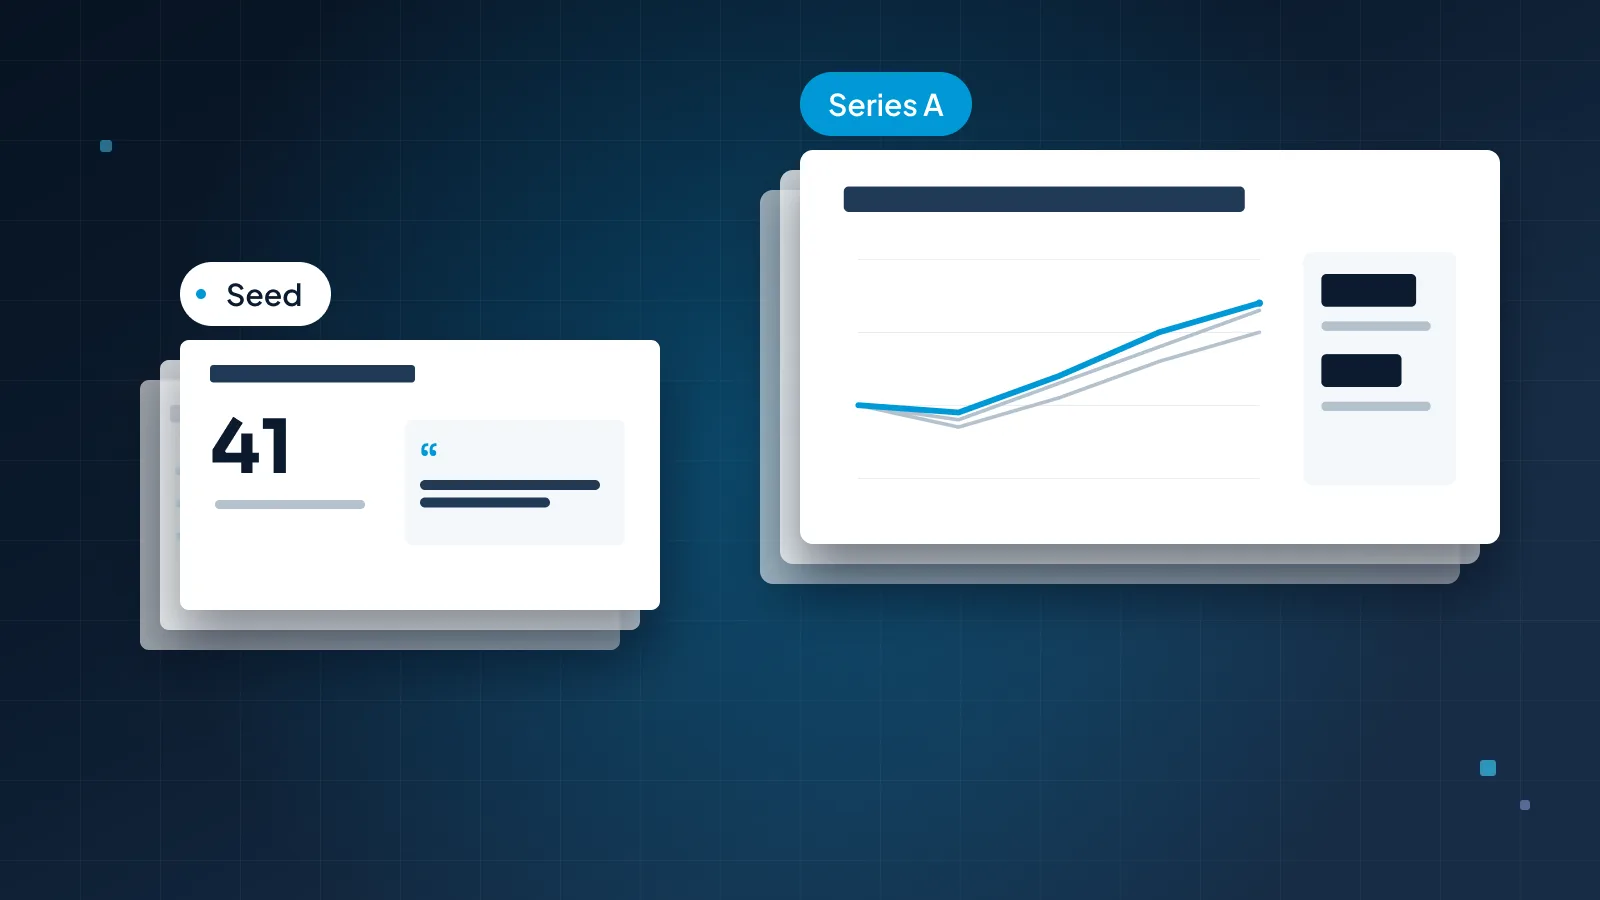
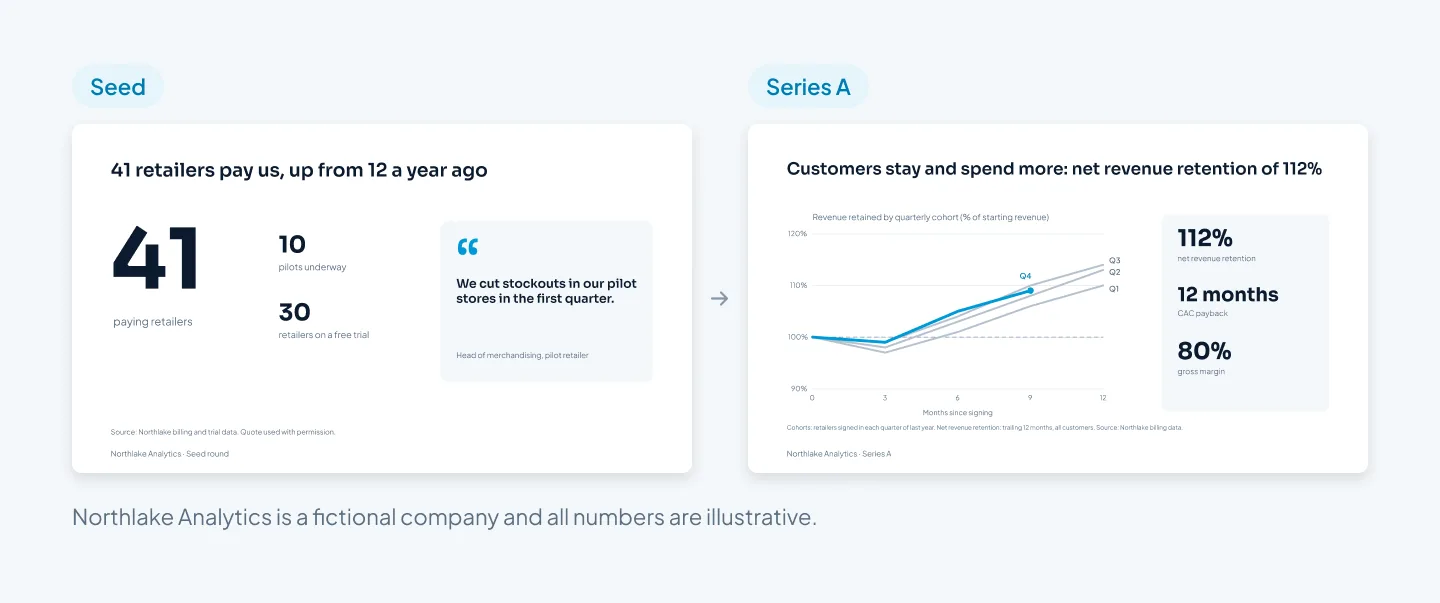
Traction: paying customers or paid pilots, shown over time. Northlake's slide reads "41 retailers pay us, up from 12 a year ago", with 10 pilots underway and 30 retailers on a free trial beneath it.
A customer voice: one short quote from a named role at a customer, used with permission.
Business model: real prices that customers pay, not the prices you intend to charge.
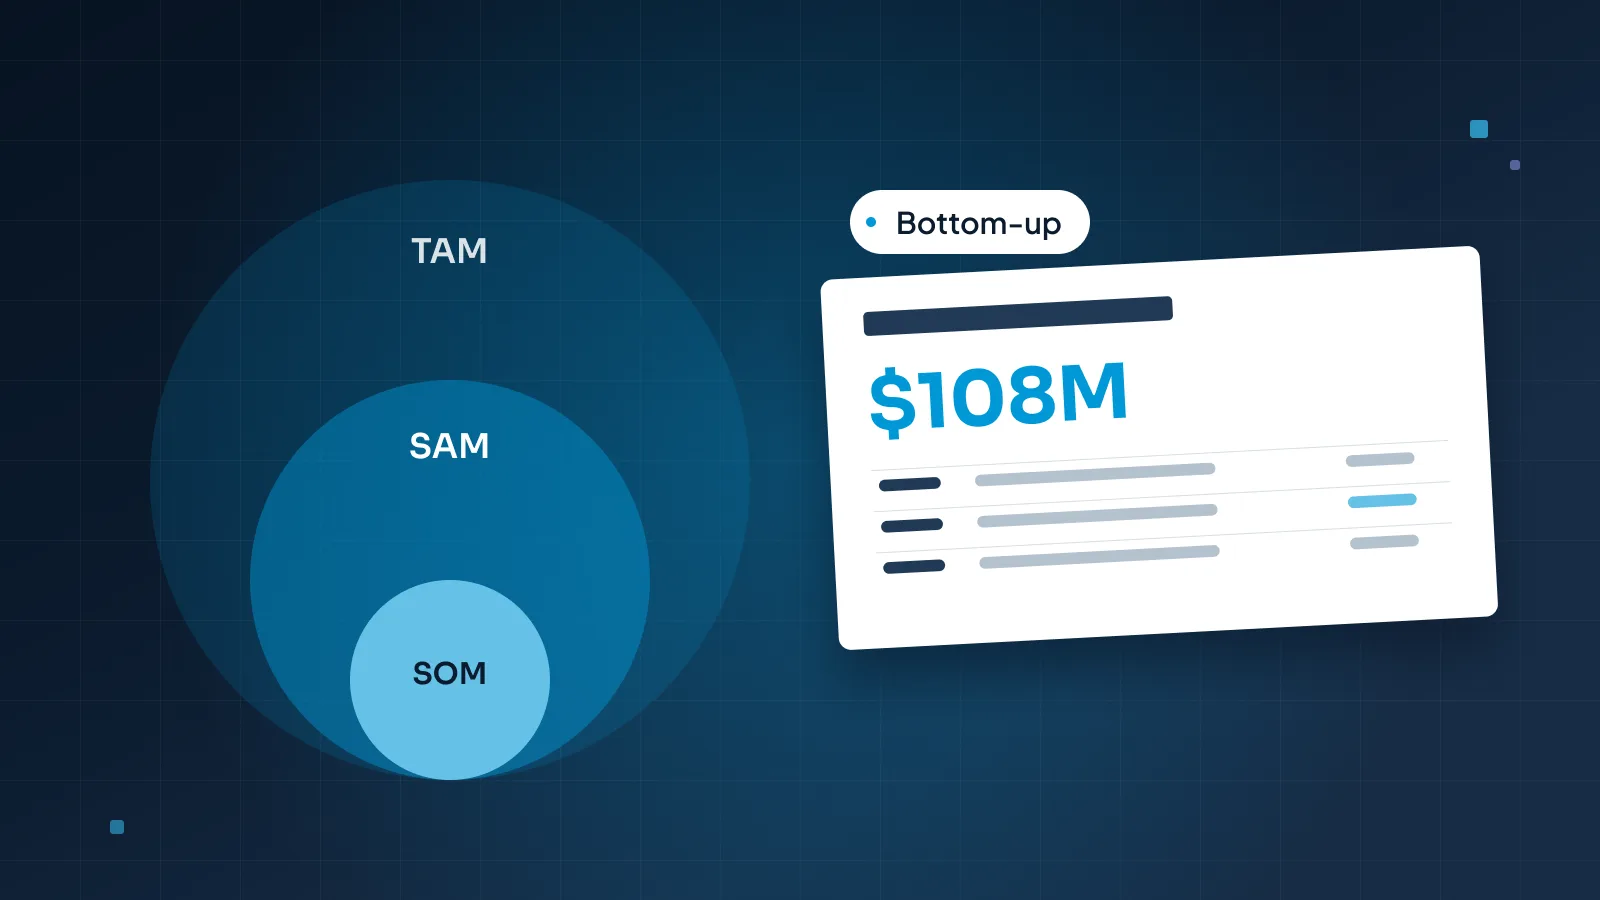
Market: a bottom-up TAM, SAM and SOM, built from the customers you can reach multiplied by what each pays a year. Our guide to showing market size in a pitch deck works through an example with every number shown.
The ask: the amount, the runway and the milestones that set up your Series A.
For a complete seed deck taken apart slide by slide, see our pitch deck examples, built around a fictional freight startup.
Cut vanity numbers. Total signups since launch, page views and press mentions look like traction but don't show that anyone pays or stays. If a number goes up whatever happens to the business, it isn't proof.
Series A: evidence the model repeats
At Series A, investors take it as given that customers want the product; that's what your seed round showed. Now they ask whether the model repeats. Do customers stay and spend more? Does it cost a predictable amount to win each one? Does that cost come back fast enough to justify spending more? And what exactly will the new money scale?
That shifts the deck from stories to systems. The evidence:
Retention by cohort: whether the customers who signed in each period stay, and whether their spending grows.
Unit economics: what it costs to win a customer, how long it takes to earn that back and what a customer is worth over time.
A growth engine: the channel that brings customers in predictably, with its numbers, such as what each sales rep closes per quarter, rather than "a strong pipeline".
A plan for the money: what you'll add (reps, a channel, a new market) and what each addition should produce, based on what it has produced so far.
A team for scale: the leaders you have, and the roles you'll hire next.
The structure stays recognizable. The traction slide changes most: at seed it shows that customers arrived, and at Series A it shows what happens after they arrive.
Slide by slide: what changes
Here's how each core slide shifts across the three stages. The slide stays; what goes on it changes.
| Slide | Pre-seed | Seed | Series A |
|---|---|---|---|
| Problem | Interviews, in customers' words | Same, plus who pays to fix it | Shorter, investors grasp it fast |
| Solution and product | Prototype, built vs planned | The live product in use | Product depth, roadmap tied to growth |
| Market | A sketch of the first segment | Bottom-up TAM, SAM and SOM | SOM tested against real win rates |
| Traction | Signals: waitlist, letters of intent | Paying customers over time | Cohort retention, NRR, revenue growth |
| Business model | Intended price, tested in interviews | Real prices, early margins | CAC, payback and lifetime value |
| Go-to-market | The first channel to test | The channel that's working | A repeatable engine, with its math |
| Team | Why this team | Key early hires | Leaders for scale, hiring plan |
| Financials | Use of funds to the next proof point | Plan to the next round's milestones | Model built on actual unit economics |
| The ask | Amount and the proof it buys | Amount, runway, milestones | How the money scales what works |
Two patterns stand out. First, the front of the deck gets shorter and the back gets deeper: by Series A, investors grasp the problem quickly and spend their time on traction, economics and the plan. Second, financials move from intention to evidence. A pre-seed plan says what you'll try. A Series A model is built on what has already happened.
Metrics slides that hold up at Series A
A Series A deck rests on a handful of metrics slides. Investors will compare them with your data room, so they have to be accurate, defined and easy to read.
Know what each metric means
Retention by cohort: of the customers who signed in a given period, how many (or how much of their revenue) remain after 3, 6 or 12 months.
Net revenue retention (NRR): revenue today from the customers you had a year ago, divided by what they paid then. It counts upgrades, downgrades and churn.
Gross margin: revenue minus the direct cost of delivering it, as a share of revenue.
Customer acquisition cost (CAC): sales and marketing spend in a period, divided by the new customers won in it.
CAC payback: the months of gross profit from a new customer it takes to earn back its CAC.
Lifetime value (LTV): the gross profit you expect from a customer over its life.
MRR and ARR: monthly and annual recurring revenue.
Burn and runway: the net cash you spend each month, and the months of cash you have left.
Put each definition in the footnote of the slide that uses it. "NRR, trailing 12 months, all customers" takes one line and saves a round of questions.
Design them to be checked
Put the result in the title. "Each new retailer pays back its acquisition cost in 12 months", not "Unit economics".
Show the math. If payback is CAC divided by monthly gross profit, put all three numbers on the slide.
Show the trend. One quarter is a data point. A payback that fell from 18 months to 12 says more than "12 months" alone.
Keep periods and definitions consistent across every slide, the appendix and the data room.
Give each chart one point, with the line or bar that matters in the accent color and the rest in gray.
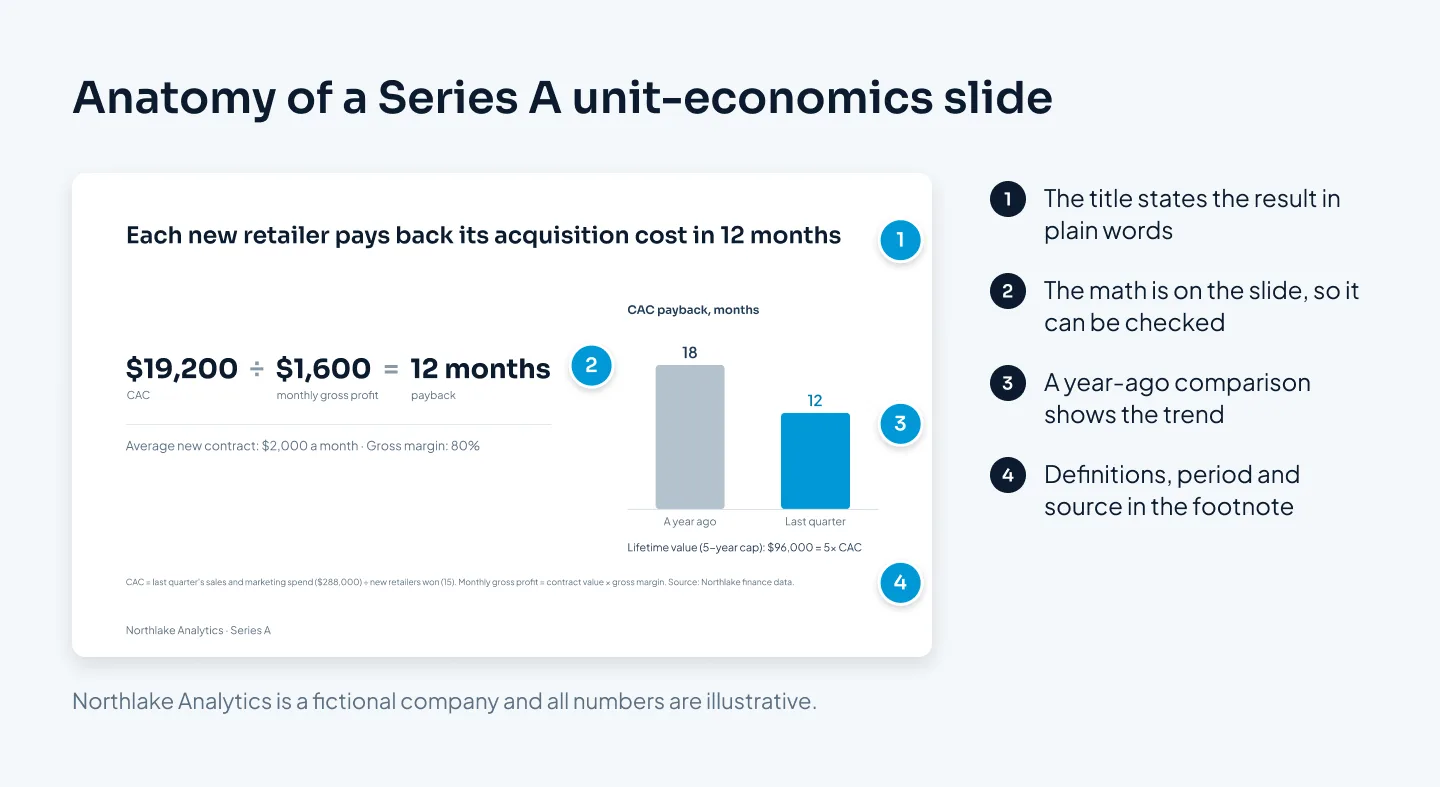
Northlake's slide shows all of it: the result in the title, the calculation, the comparison with a year ago and the definitions in the footnote. For chart choice and labeling, see our guide to presenting data in PowerPoint.
The appendix and the data room
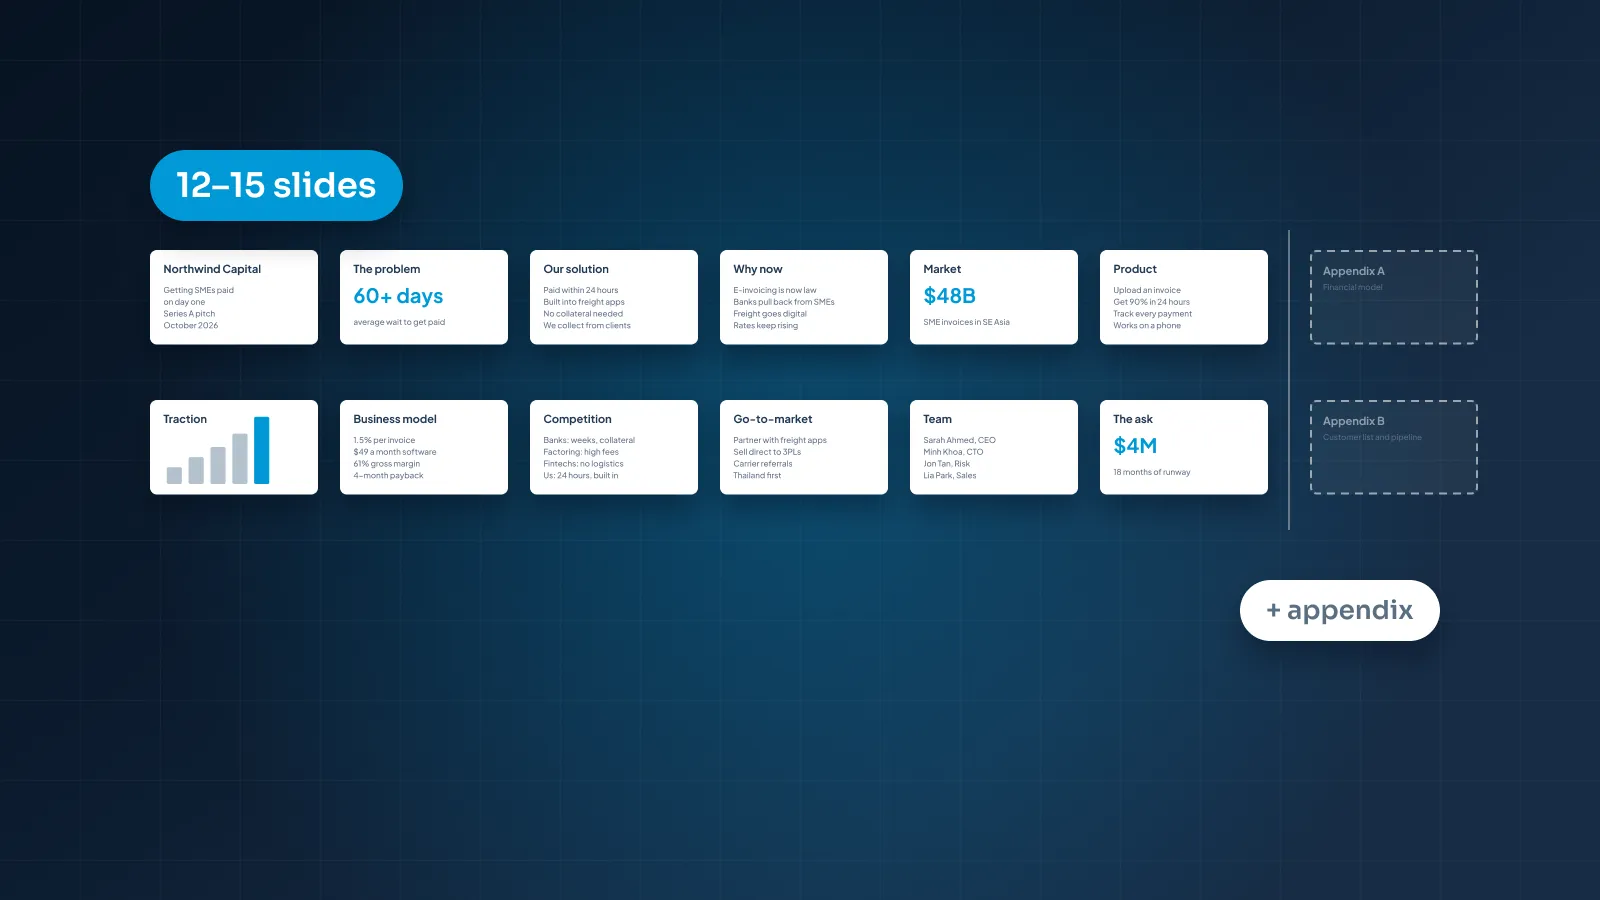
As the evidence grows, the main deck shouldn't. From seed onward, our view is a main deck of usually 12–15 slides, with an appendix for detail. What grows is everything behind it.
Think of it as three layers:
The main deck makes the argument. It's what you present, and what you send first.
The appendix answers the questions you can predict: cohort tables, unit economics by customer segment, pipeline by stage, the hiring plan, a summary of the financial model. At seed it might be a few slides. At Series A it can run longer than the main deck.
The data room proves it. It's a shared folder investors get access to during due diligence, usually holding the full financial model, historical financials, the cap table, key customer contracts and exports of the metrics behind your slides.
Moving from seed to Series A, material shifts back a layer. Customer quotes and the full competitor list move from the main deck to the appendix. Detailed cohort tables and the full financial model move from the appendix to the data room, with a summary slide left behind. Point from each layer to the next: a footnote such as "Full cohort table: appendix A4" lets a reader find the detail in seconds.
The numbers must match across all three. If ARR on a slide differs from the figure in a data room export, explain why in a footnote, such as a different date or definition, before an investor spots it.
The sent and presented versions follow the same logic. The sent deck carries enough text to stand alone; the presented one carries less, with the appendix ready behind it. Our post on pitch decks vs investor decks covers the difference. For an example of research-heavy content turned into clear slides, see the Welltech Ventures investor deck, built from market research for a wellness fund, with native PowerPoint charts.
What stays the same at every stage
Some things don't change from the first deck to the last:
One story, told in slide titles that each state a point.
Problem before solution, and proof before the ask.
One idea per slide, in a short main deck.
Numbers that match on every slide, in the appendix and in the data room.
An ask with an amount, a runway and milestones.
A design that makes each point readable in seconds: a grid, two fonts, one accent color and native charts.
The slide list barely changes between rounds. The proof on it does.
If you'd like help with the next version, our pitch deck design is $10 a slide, so a 15-slide deck is $150, with complex slides such as financial models at $15. Appendix slides are priced like any other slide, and pitch decks take 5 working days as standard. The pricing estimator shows the exact price for your deck.