The market slide gets read closely, and often doubted. Investors see a lot of very large numbers, and a big total on its own tells them little about your business. What they're really reading is whether you know who your customers are, how many there are and what they'll pay.
This guide covers what TAM, SAM and SOM mean, why bottom-up sizing is more convincing than top-down, a worked example with every multiplication shown, how to design the slide and the mistakes that cost credibility. The example is Juniper Freight, the fictional seed-stage startup from our pitch deck examples, which makes freight booking software for small shippers. The market slide is one slide in a full deck; our pitch deck guide covers the rest.
What TAM, SAM and SOM mean
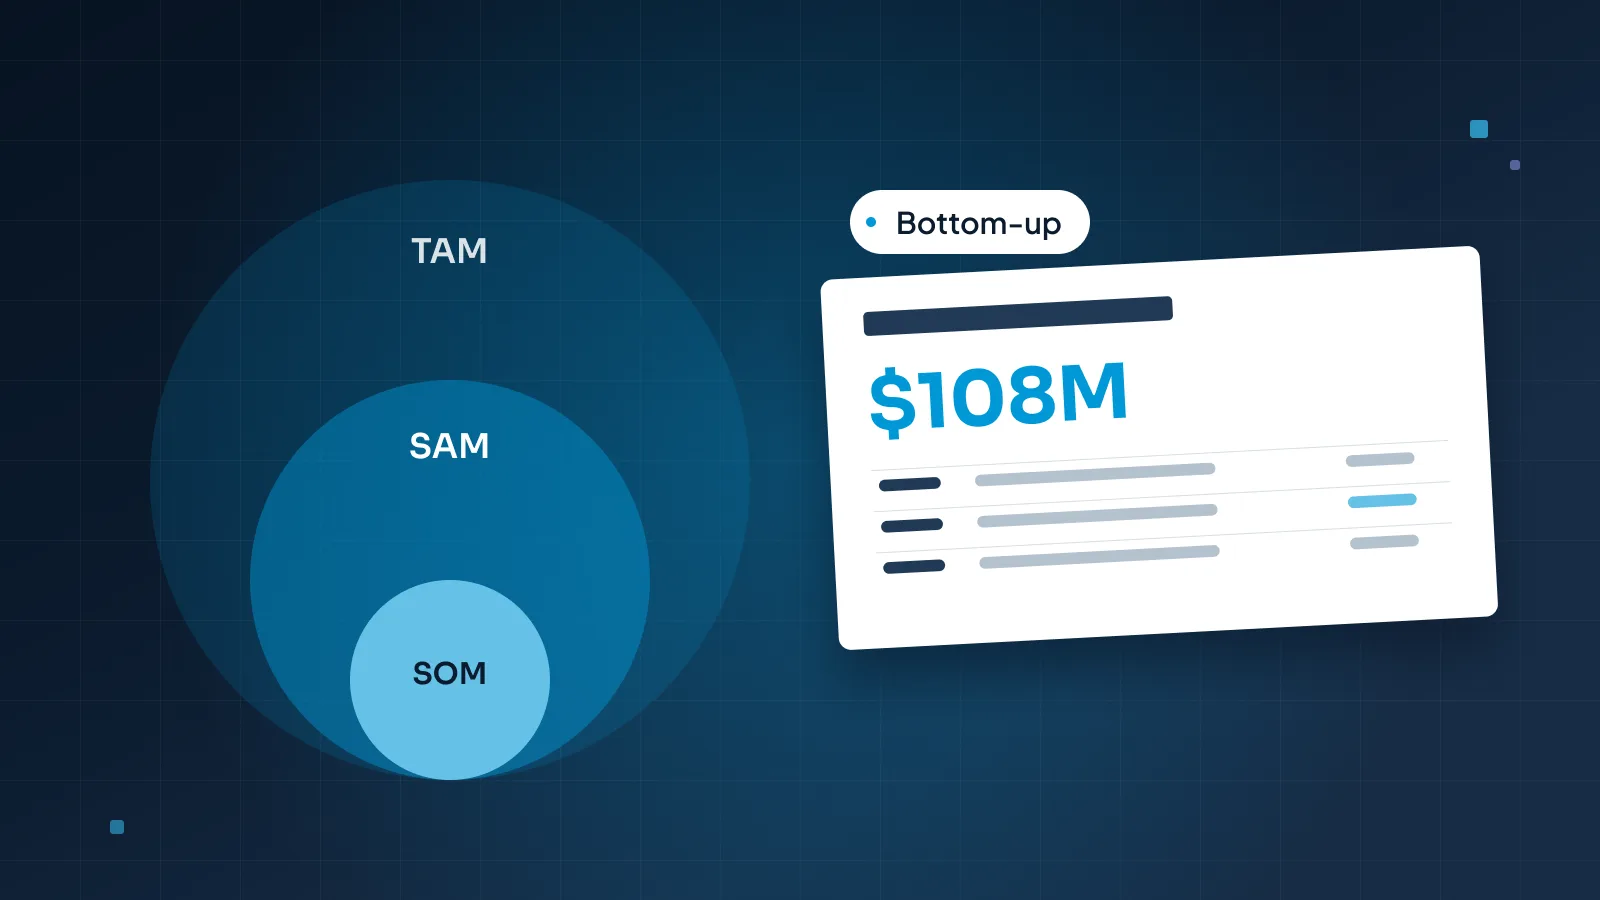
TAM, total addressable market: everyone who could buy this kind of product.
SAM, serviceable addressable market: the part of TAM you can reach with your product, business model and geography.
SOM, serviceable obtainable market: the share of SAM you can realistically win in the next few years.
Each one sits inside the one before it, which is why they're so often drawn as nested circles.
For Juniper Freight, in one line each: TAM is every small shipper in the US. SAM is the small shippers in its three launch states. SOM is the number of those shippers it can win by the end of 2030, given its sales plan.
Three habits make the numbers comparable. Express all three as revenue per year. Say which geography each one covers. And date them, because a market size from years ago describes a different market.
SOM is the one founders find hardest. It isn't a forecast for the whole company, and it isn't a percentage picked to look modest. It's a target with a plan behind it, and investors will hold it up against your traction and your ask.
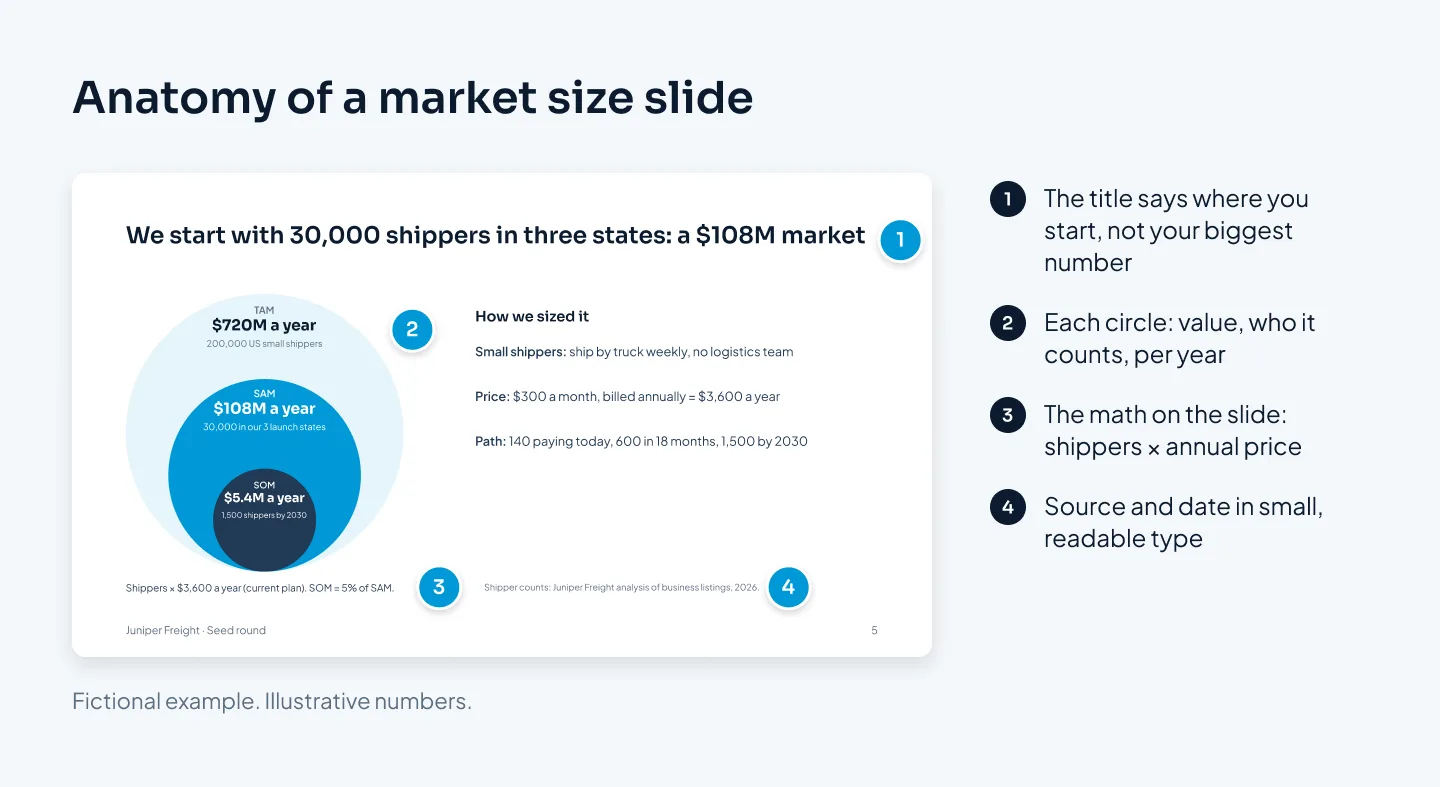
Here's where this guide ends up: Juniper Freight's finished market slide. The sections below show how each number was built and why the slide is laid out this way.
Top-down vs bottom-up sizing
There are two ways to arrive at these numbers.
Top-down starts from a published industry figure and narrows it: logistics is worth this much, trucking is a share of that, small shippers a share of that. It's quick, and it gives useful context. But the starting figure usually measures something other than what customers would pay you, and each narrowing percentage is an estimate stacked on an estimate.
Bottom-up multiplies the number of target customers you can reach by what each one pays you per year. It takes more work, because you have to define your customer precisely and count them. Investors usually find it more credible because the assumptions are visible. If they think your price is too high or your count too generous, they can change one input and see what happens. That's a conversation about your business, not about someone else's report.
| Top-down | Bottom-up | |
|---|---|---|
| Starts from | A published industry total | A count of target customers |
| Method | Narrow it by percentages | Customers × annual price |
| Shows | How big the industry is | How well you know your buyer |
| Weak point | The total rarely fits your product | Only as good as your count and price |
| Best used | As context, in a footnote | As the numbers on the slide |
The two work best together. Lead with bottom-up, and use a top-down figure as a sanity check. Juniper Freight's TAM counts what small shippers would pay for booking software, which should be a small slice of what they spend on freight itself. If your software market came out bigger than the industry it serves, something in your inputs is wrong.
A worked bottom-up example
Here's Juniper Freight's market size, step by step. The company and every number are fictional, but the method is the one to copy.
1. Define the customer precisely
Juniper Freight sells to small shippers: US businesses that ship freight by truck at least once a week and have no in-house logistics team. In practice, that means small manufacturers, wholesalers and distributors.
Both conditions matter. Businesses that rarely ship won't pay a monthly fee, and businesses with a logistics team already have their own tools.
2. Count them
Using business listings filtered by industry, size and shipping activity, the founders count 200,000 US businesses that fit. A real count would draw on sources such as business databases, industry association directories or government business statistics, and the slide's source line would name them. Keep your filters in a spreadsheet, so anyone can repeat the count.
3. Set the annual price
Juniper Freight charges $300 a month per shipper, billed annually: $3,600 a year. That's the current plan, and the same price as on the business model slide. Use what customers pay today, not a price you hope to reach later.
4. Multiply for TAM, SAM and SOM
TAM: 200,000 shippers × $3,600 = $720M a year.
SAM: 30,000 of those shippers are in Juniper Freight's three launch states. 30,000 × $3,600 = $108M a year.
SOM: 1,500 shippers by the end of 2030, which is 5% of SAM. 1,500 × $3,600 = $5.4M a year.

5. Show the path to SOM
The 1,500 needs a route, or it's just 5% picked from the air. Juniper Freight's route runs through numbers already in its deck: 140 paying shippers today, 600 by the end of the 18-month seed runway, and 1,500 by the end of 2030 as the sales team grows after the next round. Today's traction makes the first step believable, and the ask pays for it.
Then check the slides against each other. 600 shippers × $3,600 is $2.16M a year, the annual recurring revenue target on the ask slide. When the market slide, the business model and the ask use the same inputs, an investor can follow one number through the whole deck.
6. Test how sensitive it is
Investors will ask what happens if an assumption is wrong, so answer it in the appendix before they ask. At $250 a month ($3,000 a year), Juniper Freight's SAM is 30,000 × $3,000 = $90M. At $350 a month ($4,200 a year), it's 30,000 × $4,200 = $126M. The range shows the market holds up at any plausible price, and that you've thought about the price.
Later, the TAM can grow honestly: more states, larger shippers, new products. Put that expansion in a sentence or a footnote, not inside today's numbers.
Designing the market size slide
A market slide has two jobs at once: show the size and show the reasoning. Juniper Freight's slide, shown near the top of this guide, does both in five moves.
Make the title the point
Not "Market opportunity", but "We start with 30,000 shippers in three states: a $108M market". The title tells the reader where you begin, which is more useful than your biggest number.
Choose circles or bars on purpose
Nested circles show that each market sits inside the last. They're a diagram rather than a chart, and they're rarely drawn to scale: Juniper Freight's SOM would be a speck. If you want the sizes to read accurately, use three horizontal bars, or a simple table with the math in each row.
Either way, label every element with its value, who it counts and the period: "$108M a year: 30,000 shippers in our three launch states".
Keep the assumptions on the slide
One line under the diagram does most of the convincing: "Shippers × $3,600 a year (current plan). SOM = 5% of SAM." In a sent deck, that line has to be there, because you aren't. In a presented deck, you can reveal TAM, SAM and SOM one click at a time and say the math as you go.
Put sources in small type, not nowhere
A source line at the bottom names where each count came from and when. Make it the smallest text on the slide, but still readable: our starting point for labels and sources is 12 pt on presented slides and 10 pt on decks sent to be read.
One accent, where you start
Give the accent color to the market you're going after first, usually SAM, and keep the other circles in quieter tones. For more on labels and highlighting, see our guide to presenting data in PowerPoint.
Build the diagram from native PowerPoint shapes, not a pasted image, so you can change the numbers when they change.
Mistakes that cost credibility
Most weak market slides fail in the same few ways. The before slide below shows several at once.
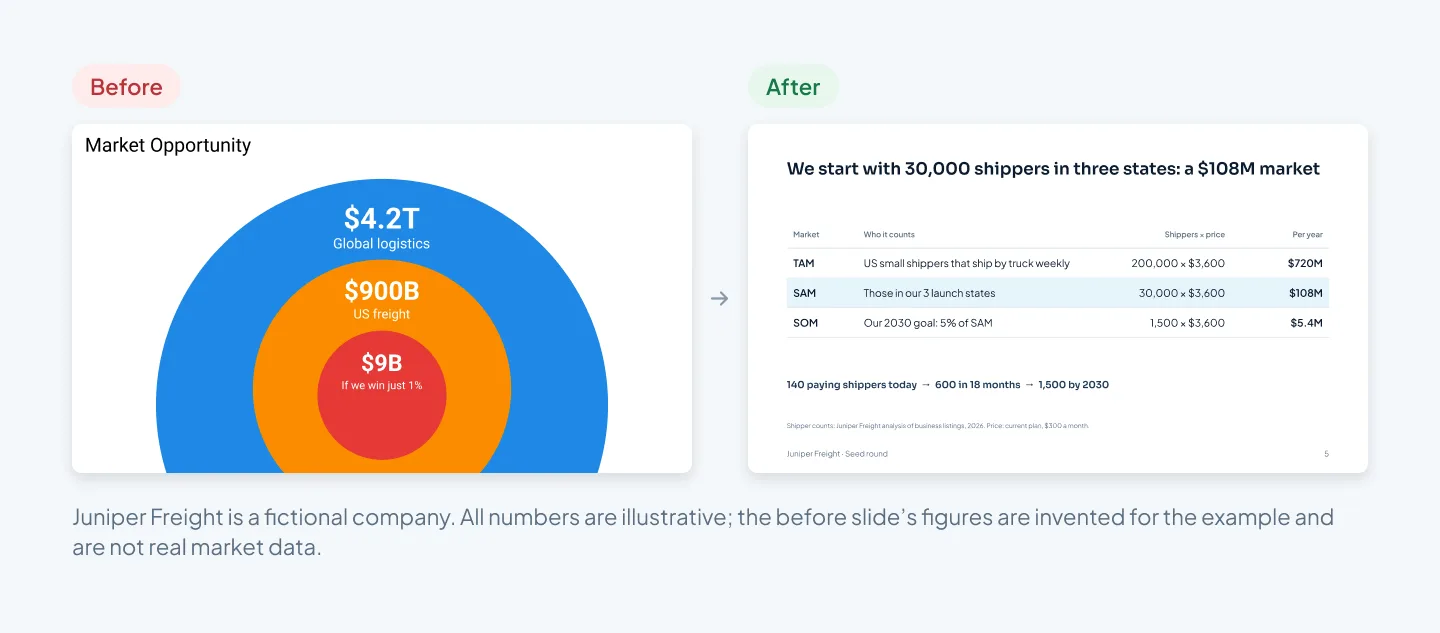
A trillion-dollar TAM from a report
A figure for global logistics describes a whole industry, most of which will never buy your product. It makes the slide bigger and the founder look less sure of who the customer is. If a report figure helps, use it as context in a footnote.
Counting money that passes through you
Small shippers spend far more on freight than they'll ever spend on booking software. If Juniper Freight sized its market by the freight its customers book, the number would look impressive and have nothing to do with its revenue. Size the market by what customers pay you.
A SOM with no path
"If we win just 1%" is a familiar line on weak market slides. One percent of a huge number is still a huge number, and it says nothing about how you'd win it. Tie SOM to your traction, your sales capacity and the milestones in your ask.
Circles with no math
Three circles with three totals and nothing between them ask the investor to take you on trust. The multiplication is what earns that trust.
Numbers that don't match the rest of the deck
If the market slide uses $3,600 a year and the business model slide says $250 a month, one of them is wrong, and the investor now wonders what else is. Use the same price, customer definition and dates on every slide. Our post on pitch deck design mistakes covers mismatched numbers and the other errors that lose investors.
Mixed units, years and places
A global figure next to a US count, an old report beside this year's data, a lifetime value next to annual revenue: each mix makes the totals impossible to compare. Use one unit (revenue per year), one date and a clear geography for every circle.
A big number gets attention. The math behind it gets belief.
Sources, assumptions and the appendix
The slide shows the result. The evidence behind it belongs in three places:
On the slide: the assumptions line and a short source line, with dates.
In the appendix: one slide with the full calculation, the filters behind your customer count, a breakdown by state or customer size and the sensitivity range. Title it with the question it answers, such as "How we sized the market", so you can find it fast when someone asks.
In the data room: the spreadsheet itself, with every source listed, so an investor's analyst can rerun it.
Name your sources specifically. "Industry data" isn't a source. "Juniper Freight analysis of business listings, filtered by industry, size and shipping activity, 2026" is. When you use a published figure, give the publisher and the year, and say what it measures.
Keep one source of truth. The spreadsheet feeds the slides, not the other way round, and when a number changes you update both on the same day.
Expect sharper questions in later rounds. At Series A, investors may test your SOM against your actual win rates and sales capacity; our post on seed vs Series A pitch decks covers what changes. For an example of research turned into clear, native PowerPoint charts, see the Welltech Ventures investor deck, built from market research for a wellness fund.
If you'd like the whole deck designed around a market slide like this, our pitch deck design is $10 a slide, so a 15-slide deck is $150, plus $5 for each complex slide. Check your own deck in the pricing estimator.