
Most founders look at other decks before they build their own. That's sensible, but a folder of downloaded decks rarely helps as much as you'd hope. You see the slides without the reasoning, from companies at a different stage, in a different market, often from a different era of fundraising.
So this post takes another approach. We walk through one complete seed deck for Juniper Freight, a fictional seed-stage startup that makes freight booking software for small shippers. For each slide you'll see what it says, what it shows, why it works and the weak version founders often make instead. Then we show real slides from our studio, and how to use any example without copying it. If you're starting from a blank page, our pitch deck guide covers the full structure and story first.
What makes a pitch deck example worth learning from
A good example isn't just a good-looking slide. It's one you can learn a decision from. Before you study any deck, check it against four things:
You can see the whole deck. A single polished traction slide tells you little. The order, and how each slide sets up the next, is most of what makes a deck work.
You can tell what each slide proves. If you can't say in one sentence what a slide is trying to convince you of, you can't apply it to your own deck.
The numbers hold together. The price on the business model slide should match the one in the market math, and the customer count on the traction slide should lead to the milestone in the ask. Examples that don't add up teach bad habits.
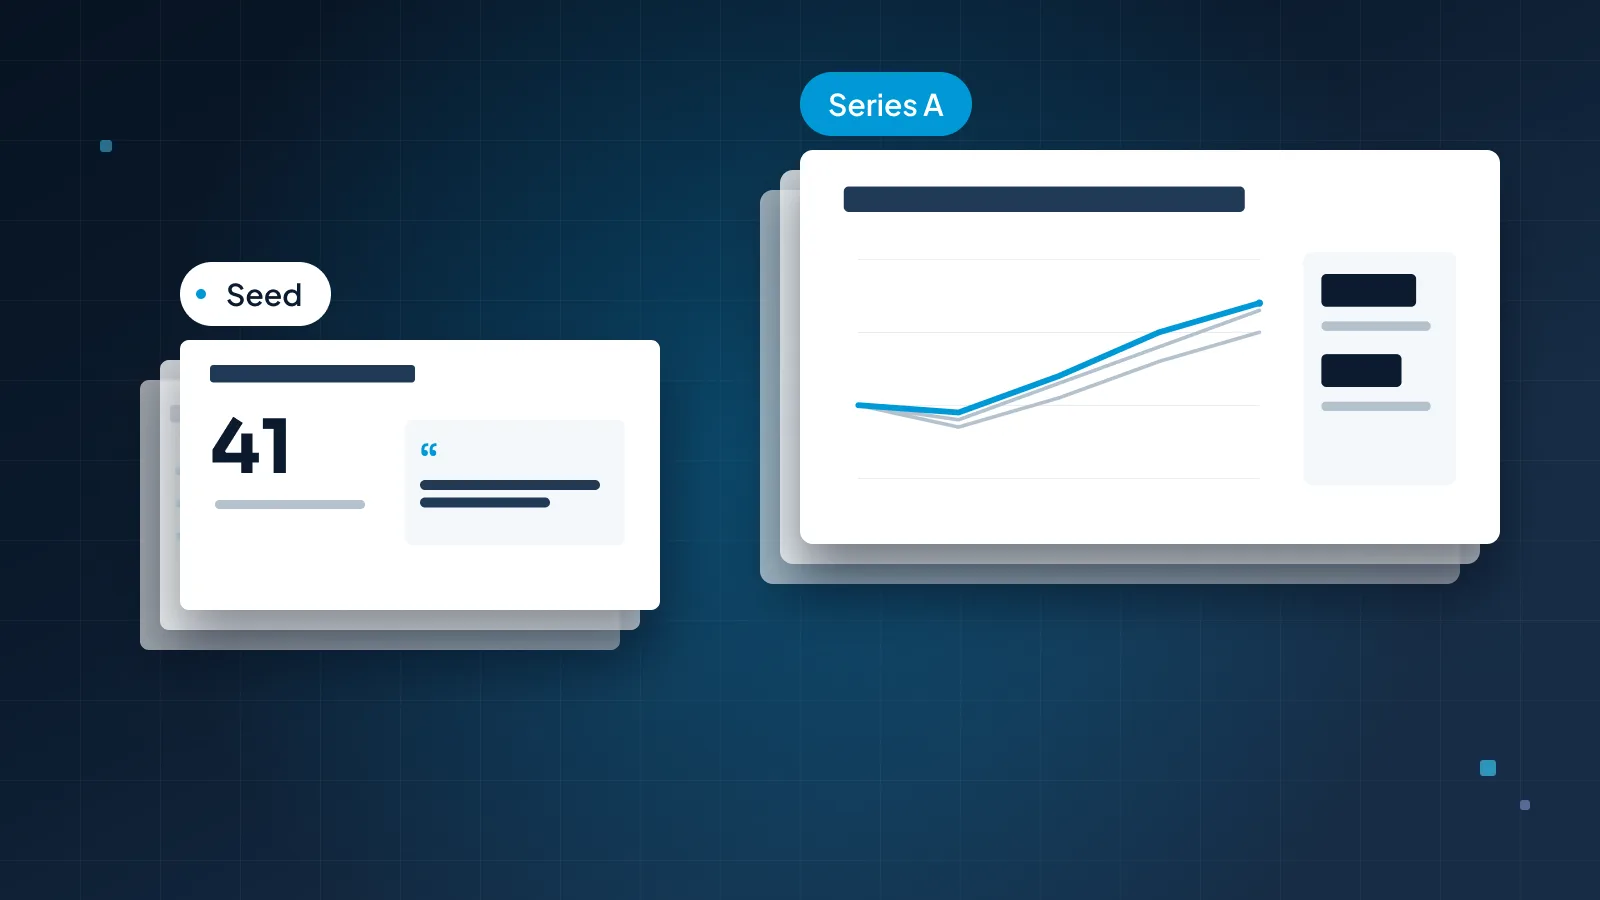
It matches your stage. A Series A deck full of cohort charts is a poor model for a pre-seed raise. Our post on seed vs Series A pitch decks explains what changes from round to round.
Juniper Freight's deck is built to pass all four. It's fictional, so we can show every slide and every number, and explain the choices behind them.
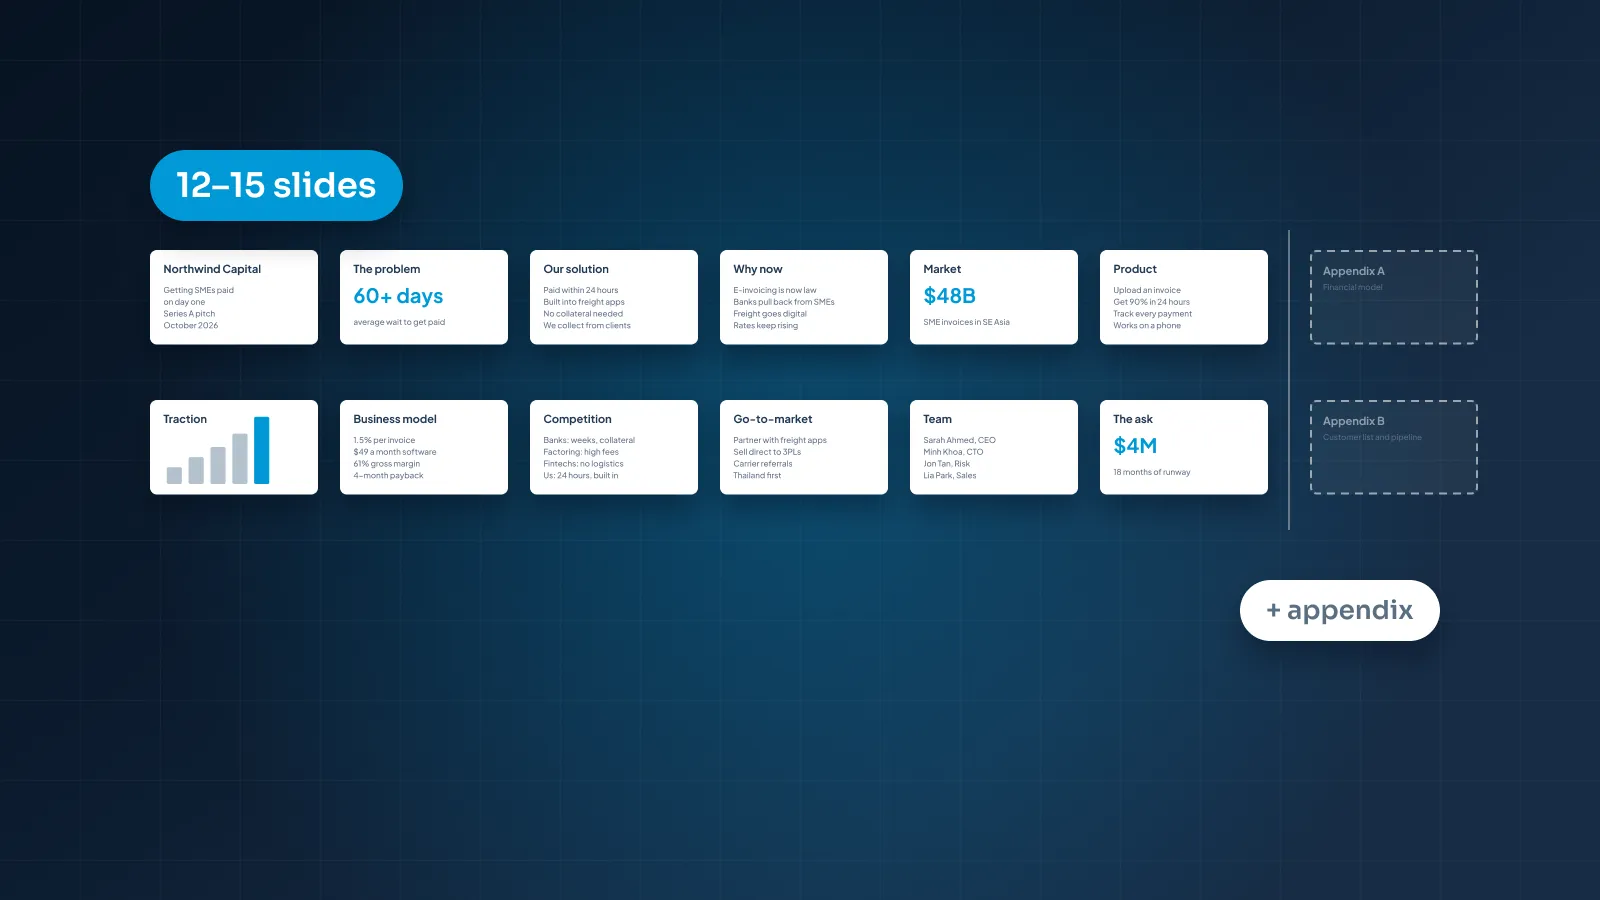
A note on length: these are the ten slides investors look at hardest, not the whole deck. Juniper Freight's full main deck also has why now, go-to-market and financials slides, which brings it to 13. Our view is that a main deck usually runs 12–15 slides, with an appendix for detail. For how that shifts by format, see how many slides a pitch deck should be.

The 10 slides, one by one
Each slide below follows the same pattern: what it says (the title on the slide), what it shows, why it works and the weak version to avoid.
1. Title and one-line pitch
What it says: "Book a regional truck in minutes, not a morning of phone calls." Beneath it, smaller: "Juniper Freight: freight booking software for small shippers."
What it shows: a small logo and that one line, set as the largest type on the slide. On the sent version, the founder's name, email and "Seed round, October 2026" sit at the bottom.
Why it works: in two lines, the reader knows what the company does, who it's for and what changes for them. Every slide after this one builds on that sentence.
The weak version: a large logo over a tagline like "Reinventing logistics". It sounds confident and says nothing about the product or the customer, so the reader starts slide 2 still guessing.
2. Problem
What it says: "Small shippers spend two hours booking every truck."
What it shows: one customer scene: an operations manager at a 40-person food distributor, phoning carriers and comparing quotes by email. Beside it, one large number: "2 hours per load". A small source line says the figure comes from the founders' interviews with 60 small shippers.
Why it works: it names who has the problem, what it costs and how often it happens. A shipper booking several trucks a week loses most of a working day to it. The investor can picture the person and do the math.
The weak version: five bullets of industry language, such as "fragmented market", "lack of transparency" and "legacy processes". Nobody in particular has those problems, so nobody in particular will pay to fix them.
3. Solution
What it says: "Compare live rates, book and track a truck in one place."
What it shows: three steps, left to right, with a short label under each: enter the load, pick a carrier from live rates, track it to delivery with one invoice.
Why it works: it answers the problem slide in its own terms. Two hours of calls become three steps on a screen, and the reader doesn't need a product tour to believe it's faster.
The weak version: "An AI-powered platform that optimizes logistics end to end." Every word is an adjective or a category. The reader can't picture what happens when a shipper opens it.
4. Product
What it says: "Shippers book a load in under five minutes."
What it shows: a cropped screenshot of the booking screen: three carrier options with prices and pickup times, and one callout pointing to the live rates.
Why it works: it proves the product exists, and the crop puts the reader's eye on the one feature that solves the problem. The title turns a screenshot into a claim.
The weak version: the full dashboard, shrunk to fit the slide, so every label is unreadable. Or a mockup on a tilted laptop that shows off the frame more than the product.
5. Market size
What it says: "We start with 30,000 shippers in three states: a $108M market."
What it shows: three nested circles. TAM: $720M a year, from 200,000 US small shippers. SAM: $108M, the 30,000 shippers in Juniper Freight's three launch states. SOM: $5.4M, the 1,500 shippers it aims to win by 2030. One line underneath shows the math: shippers × $3,600 a year, the current price.
Why it works: it's bottom-up. Every figure is a count of customers multiplied by what each pays, so an investor can test the inputs instead of taking a total on trust. The price matches the business model slide, and the title points to where the company starts, not to its biggest number.
The weak version: a trillion-dollar figure for global logistics, copied from a report with no source, above the line "if we win just 1%". We take that slide apart, and build Juniper Freight's numbers step by step, in how to show market size in a pitch deck.
6. Traction
What it says: "Paying shippers grew 4x in six months, to 140."
What it shows: "140" as the big number, and a small bar chart of paying shippers each month from March (35) to September (140), with the latest bar in the accent color. Two supporting figures sit beneath it: $504k in annual recurring revenue and 3 cancellations since launch. A source line gives the data and the dates.
Why it works: one metric, plotted over time, with the result in the title. Monthly values show the trend honestly, and the two supporting figures answer the next questions, revenue and churn, without crowding the chart.
The weak version: the same facts in a paragraph under the title "Traction". The numbers are all there; the reader just has to dig them out.

The free-trial count from the paragraph didn't make the redesign. It's useful, but it's pipeline rather than traction, so it moves to the speaker notes or the appendix.
7. Business model
What it says: "Shippers pay $300 a month, billed annually."
What it shows: that line in large type, with three small facts beneath it: $3,600 a year per shipper, carriers join free, 80% gross margin.
Why it works: it answers who pays, how much and how often in one glance. The $3,600 is the same number that drives the market slide and the ask, so the deck checks out wherever an investor looks.
The weak version: a screenshot of a pricing page with three tiers and rows of feature ticks. Or a list of "revenue streams" (subscriptions, data, advertising, transactions) with no prices, which reads like a company that hasn't chosen its model.
8. Competition
What it says: "The only booking tool built for shippers with no logistics team."
What it shows: a comparison table. The columns are Juniper Freight and what small shippers use today: freight brokers, load boards, enterprise shipping software, and a phone and a spreadsheet. The rows are what buyers choose on: live rates in minutes, setup in a day, tracking with one invoice, and handling unusual loads. Brokers get the tick for unusual loads. Juniper Freight doesn't.
Why it works: it names the real alternatives, including the unglamorous one most small shippers use now. And it concedes a point. One honest cross makes every tick more believable.
The weak version: a 2×2 grid where Juniper Freight sits alone in the top-right corner, on axes nobody buys on. Or a slide that says "no direct competitors". Both suggest the founders haven't looked closely.
9. Team
What it says: "We've run dispatch, built booking software and sold to small shippers."
What it shows: three founders in matching photos, with one line of proof each. The CEO ran dispatch for a 120-truck regional carrier for six years. The CTO built the booking engine at a travel software company. The COO managed carrier relations at a regional freight broker.
Why it works: the title names the three things this plan needs, and each founder covers one of them. Investors back people for a specific plan, and this slide connects the two.
The weak version: long bios in small type, a row of past-employer logos with no explanation, and four advisors with no stated role.
10. The ask and use of funds
What it says: "Raising $2.5M seed: 18 months to 600 paying shippers."
What it shows: the amount and the milestone as the largest elements. Beneath them, use of funds in three lines, each tied to the milestone: $1.1M for three sales reps and onboarding, $0.9M for product, including self-serve booking, and $0.5M to complete the carrier network in all three states. A small line notes that 600 shippers at $3,600 a year is $2.16M in annual recurring revenue.
Why it works: amount, runway and milestone fit in one sentence, and the three lines add up to the amount. Investors can see what their money buys and where the company will be when it's spent. The 600 also sits on the path to the 1,500 shippers on the market slide.
The weak version: "Raising $2.5M" above a pie chart of departments, followed by a "Thank you" slide. In a presented deck, end on the ask instead, so it stays on screen during questions.
Notice what runs through all ten. Every title is a statement. Every number appears in the same form wherever it shows up: 140 shippers, $3,600 a year, $2.5M. And each slide answers the question the previous one raised. Most of the problems in pitch deck design mistakes that lose investors are breaks in one of those three habits.
Real decks from our studio
A fictional deck lets us show every slide and every number. Finished work is where you see the design itself: type, layout, charts and how a deck holds together on one brand. These four come from our case studies.

xSphere: a startup pitch deck for a telecom company working in roaming and eSIM.
Welltech Ventures: an investor deck for a wellness fund, built from market research, with native PowerPoint charts.
aiScout: a PowerPoint pitch deck template, so every future deck stays on brand.
Contoso: a pitch deck template built on a sample brand. It's a studio template rather than client work.
The two templates show a step founders often skip. Once your story works, a template turns it into a system. The next investor update, the Series A deck and the sales deck all start from the same master, instead of from a copy of a copy.
How to use examples without copying them
Examples are most useful as a set of questions. Here's how to use them without ending up with someone else's deck.
Borrow the question, not the answer
Every good slide answers a question an investor has at that point in the deck. Juniper Freight's problem slide answers "who is losing what, and how often?" Write that question down, then answer it for your business. Your answer may need a different layout altogether.
Every example slide answers a question. Borrow the question, not the answer.
Borrow the logic, not the look
Structure and reasoning carry over between companies; visual style doesn't. A dark, photo-led deck that suits a consumer brand can feel wrong for enterprise software. Build your look from your own brand: your fonts, your colors, your product screens.
Never borrow numbers or claims
Don't lift a market size from another company's deck, even one in your sector. Their TAM counted their customers at their price. The same goes for benchmarks you can't source. If a number is on your slide, you should be able to show where it came from.
Match the example to your stage
A pre-seed deck can't show cohort retention, and shouldn't pretend to. A Series A deck that still leans on one customer quote looks thin. Study examples from your own stage, or one round ahead at most.
Keep a swipe file, with notes
If you'd like a designer to take your deck from draft to finished, our pitch deck design service is $10 a slide, so a 15-slide deck is $150. Complex slides such as market maps and financial models are $15. Pitch decks take 5 working days as standard, or 48 hours with Express, which adds 25% to the design fee. The pricing estimator shows your exact price before you order.